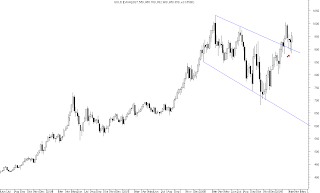
"If prices are able to close above 13700 for the week, it would be bullish. Nickel can rise to 17500 - 18000 range on a sustained breakout above this level" - Last update on Nickel.
The current picture on graphs looks like this -
Prices have come out of a range after nearly 8 months and look set to rise further. I see just one concern here that Nickel inventory remains very high relative to other metals. The LME inventory and other private warehouse stocks are still high. Weak demand combined with high availability of the metal has been able to cap prices for quite sometime. Look for a surge in volume for prices to confirm the current uptrend. Risk levels are now at $13000.
Showing posts with label Metals Market Perspective. Show all posts
Tuesday, June 02, 2009
WTIC and Copper wave count update
Last update showed how these two commodities are entering the 5th wave impulse. Copper prices have risen strongly and are now at fresh highs for 2009. The 5th wave of the wave '1' of new impulse is now in progress. Strong confluence resistance rests at levels of 242 and then 250 - 264 range. The triangle formation completion has invalidated the previous alternate count and emphasized the base count. See the following graph
Crude oil entered the 5th wave of wave 'C' of final corrective wave 4. The wave 3 of 5 is nearing completion and crude oil might take a breather before tracing out wave 4 and 5. Please see previous post for complete update. Following is the short term graph -
There is strong confluence resistance at $68 - $72 range. Look for rally to exhaust at these levels. Further resistance is at $76 if these levels do not hold.
Labels:
Energy,
Metals Market Perspective
Friday, May 29, 2009
Nickel is back in action!!!
Nickel prices went into a deep consolidation/basing out pattern for the last 8 months. Price is now above all significant DMA levels.
If prices are able to close above 13700 for the week, it would be bullish. Nickel can rise to 17500 - 18000 range on a sustained breakout above this level.
Labels:
Metals Market Perspective
Wednesday, May 27, 2009
Crude oil and copper wave count
Crude oil and copper has given an impressive rally in the past few months. Copper prices bottomed out before equity markets started the current uptrend and crude oil followed with a lag.
The current market picture in copper is impressive as elliott wave structure saw termination of the bear trend at the bottom. Now copper is in the process of forming the first impulse of the new bull market. The following graph will make it clear.
The alternate count shown above will have a very high probability if copper trades below 200 for a few days. Termination of wave 1 may occur at 245-250 range if the triangle completes.
Crude oil prices have rebounded sharply. As I had mentioned in the last post here that crude oil is still in the fourth wave of the wave 'A' correction, it has taken an expected amount of time to reach the current price levels. The current price picture is now calling for termination of the current uptrend in few weeks. Take a look at this graph. For previous posts see this link
Crude oil rally looks like nearing exhaustion. On hourly graphs we have entered the wave 5 of 5 of C. Look for reversal pattern in days to come, retracements can be very deep.
Labels:
Energy,
Metals Market Perspective
Tuesday, May 26, 2009
Elliott Wave Count on Gold - X
Looks like current price move is going to make new highs. I have highlighted this fact in the previous post.
View all posts on Elliott Wave Count on Gold - Click here
Please take a look at the graph below. Risk reward is now in favour of bulls. $860 is now a clear support for upside targets of $1200.
Long term trend now looks like this-
View all posts on Elliott Wave Count on Gold - Click here
Please take a look at the graph below. Risk reward is now in favour of bulls. $860 is now a clear support for upside targets of $1200.
Long term trend now looks like this-
Labels:
Gold,
Metals Market Perspective
Monday, March 23, 2009
Elliott Wave Count on Gold - IX
Gold prices have done nothing in the last six months. Gold is one of the few asset class which has not declined in price compared to massive decline in other asset classes. From being a long term bull in gold and maintaining the view that gold prices are headed to $1200 over a period of time, I have become cautious of the rising bearishness in the underlying gold market. I have expressed this opinion in my intermarket articles which called for a top in gold when it touched $1000 few weeks back. See this link
The continuous flow of funds to ETFs has been taken as a big positive for gold's bullish case. I don't share that view. The mass investments always don't do good in terms of returns. Gold price in terms of Asian currencies have been very strong and especially in terms of INR. Gold priced in INR terms has made higher highs continuously and still looks like it is forming a consolidation inside a flag. The INR depreciation has played a pivotal role in the current rise in gold prices in India.
My last elliott wave count involved the probability that gold was forming an ending diagonal in the double zig zag final upleg 'c'. However that proved dead wrong as gold first declined nearly $80 and then gave a strong upward rally negating the formation.
I am revising my long term wave count in gold. Primarily I think gold is still in the wave four forming the second leg of a ABC-X-ABC flat or an expanded pattern. Take a look -
The current move in gold being the intermediate corrective wave can rise disproportionately. The wave structure in gold prices is quite complex and the fall should happen in simple ABC correction once the intermediate 'x' completes.
The view that gold prices might break to new highs before declining comes from the fact that prices have again broken out of consolidation. A giant broadening formation has been successfully tested in gold which gives an expected target price of around $1210. See the graph below -
The short term wave count looks like we have entered the wave 'c' in the flat or an expanded abc wave. Take a look -
Gold has been viewed as safe haven and it has risen quite well relative to the financial sector in the US. The S&P Bank index relative performance to the S&P 500 has been quite useful in understanding the short term strength in the risk aversion sentiment. S&PBank Index/S&P500 has been moving inversely to gold prices since the crisis began and shows how market is pricing in the risk sentiment in two different markets.
The financial media and other market participants are focusing attention on making a bullish case for gold. When markets price in deflation expectation, gold prices are 'expected' to rise due to risk aversion and in inflationary expectation buildup it is the inflation hedge that makes gold attractive. However, gold prices have done very little to make that case for itself.
Gold prices stand at $950 at present and a blow-off rally can actually take place if investors run wild in buying all the gold they can. This might happen if gold pushes to new highs, but a large upmove sustaining its head for long looks less probable. From where the market stands, it looks an attractive counter to go short if it breaches $880 again. That would in time lead to the biggest sell-off that the current crisis has unfolded. Meanwhile, let the price resolve out of this trading band
Labels:
Gold,
Metals Market Perspective
Tuesday, November 25, 2008
Elliott Wave Count on Gold - VIII
I have maintained my bullish outlook in gold for quite a while. In a presentation this year I expressed the view that gold price would rally to $1200 along with the rising USD. Since September gold is up nearly 12 percent and USD Index is up nearly 13 percent. Though both the markets have behaved in an expected manner, the volatility has led to very little trading being profitable. Overall I still feel that the major trend for gold has still not ended and it is resolving into a much stronger trend for a larger time frame.
In the last one month gold prices have rallied up from a low of $680. Elliott wave analysis in gold has given quite a few counts and there is a possibility that we may seen one more low before the next move up.
In my previous post ( Gold Update ) I mentioned that we may have seen the low of $734 as the important bottom in gold. But as mentioned gold prices closed below $730 and made a low of $680. The rise in gold prices which took markets up to $934 came in three wave and the next fall was also in three ways. Take a look at the graph -
In my view a major bearish pattern has been formed at $935 and unless prices go above $950 this latest count will remain my most probable count. On a weekly graph the gold price count looks like this -
We are currently in the 'C' wave of wave 'B' of the second ABC zig zag in gold. The USD has broken down and gold prices have been moving independent of this fact. Any major reversal in USD can lead to severe weakness in gold prices. USD has entered a strong upmove and has formed a bottom for this decade. Long term trend in USD is decisively bearish and in gold decisively bullish. Medium term trend can see the reversal of trend. I am writing this at a point where gold prices have shown immense strength. From a market sentiment point of view I think all market participants have become bullish.
Huge volatility in prices is generally a sign of market weakness. Gold has seen huge amount of buying from a lot of investors and amid the 'Financial Armageddon' gold prices have failed to make a new high. Overall I feel gold prices would find a bottom at $550 if they are unable to hold $640 on a weekly closing basis. On a relative comparison basis gold would be a steal at $600 range for the long term investors. My long term targets of $1200 and above remain the same. But prices need to resolve meaning fully to reach these prices.
In the very short term prices face immense resistance at $832 and $854. If prices close above these levels gold might rise to $880 to $900 before falling to sub $700 levels. I feel any bearish pattern at $850 and above should be used for initiating a bearish price objective on gold.
Labels:
Gold,
Metals Market Perspective
Friday, November 07, 2008
Similar Graphs - Similar result
Crude oil, copper and DJIA gave some positive up move signs. None was able to hold to support levels and now has broken down.
Copper and crude oil has given bearish breakdowns. Copper looks set to test its lows and crude oil may decline to $50 if it doesn't go above $65.5 on daily close. Take a look -
Crude oil
Copper
Prices may see some retest of resistance levels before going down.
Copper and crude oil has given bearish breakdowns. Copper looks set to test its lows and crude oil may decline to $50 if it doesn't go above $65.5 on daily close. Take a look -
Crude oil
Copper
Prices may see some retest of resistance levels before going down.
Labels:
Energy,
Metals Market Perspective
Wednesday, November 05, 2008
Three similar graphs
Take a look at these three graphs ( open in new windows separately)
Copper
Crude oil
Dow Jones Industrials
All these three graphs have a few things in common.
- MACD has given a crossover from very oversold levels.
- A double bottom is formed in Dow Jones on a daily chart, crude oil on a 240 minutes graph and copper on an hourly graph.
- Dow Jones is nearing its short term resistance level and RSI is getting into a congestion zone; Crude oil has formed a bullish engulfing pattern with a strong break on the RSI; copper HG has tested $1.78 three times in the last three days
There is a possibility of a significant rally in crude oil and copper as i mentioned in the last crude oil post. Short term resistance level of $72 was the top yesterday and $76 may see some more profit booking.
Copper is looking set to touch $2.08 and $2.25 after that breakout.
Labels:
Energy,
Metals Market Perspective,
Stocks
Tuesday, August 12, 2008
Elliott Wave Count on Gold - VI
In the previous update last month I wrote -
http://sahilkaps.blogspot.com/2008/07/elliott-wave-count-on-gold-v.html
. . . . . . On a longer term basis Gold looks weak and a fall below $873 will make $850 highly probable. Looking at longer term graphs, Gold prices are expected to remain weak for an extended period now. Worst case scenario can take gold prices down to $716 on a break below $845 . . . .
Gold prices have fallen as expected. Bullish market participants have been hit hard and gold decline surprised everyone. I was surprised by the intensity of the fall from $870 to $802 in the international spot markets. $850 had been a very strong strong support and all traders who trade logically or otherwise would have kept their stops at that level which got triggered. Being short in gold from very comfortable level did serve well. looking at the current price levels, $800 and $790 looks important pivot levels which would lead to further buildup of positions in the gold markets. I feel a material damage has already been done to the market as we enter the 'official bear market' in gold.
It is worth mentioning here the August plunge in gold happened in 2007 as well and was quickly bought into. Gold bugs are again expecting the same result this year and any rebound in gold will see some bugs come back into the market. This would result in sharp pull back. We must keep an eye on any reversal pattern on charts which may signal a pull back as prices remain highly oversold. The part of gold fall can be attributed to a rise in USD but it is important to note that gold peaked nearly 3 months before USD turned the tide. This means the fall is not entirely due to the USD.
Looking at the Elliott wave structure we see market nearing an important bear channel support. Take a look
It is not wise to catch a falling knife. We should not buy weakness even at this level unless we see a strong reversal pattern. But strength has to be sold into. Seasonally gold is approaching a strong season. Physical buying in India and other nations will gain strength in September. Gold ETF volumes have fallen sharply in the last one week. There has been some buying in India spot markets but it has been too low and too late. The investment demand for Gold has suffered badly due to low liquidity and its role as a safe haven has been deeply undermined. I say this because in the time of current financial market turmoil and highest inflation levels in nearly last quarter of a century gold has not done too great. Euro has now gone out of favour as investors realize that Euro Area is no better than the US. Euro has fallen gap down and I feel this gap is a material one. Though we may see a rebound in Euro and Gold material damage has been done. Gold overall looks quite oversold and selling may not yield great results from current level of $814.
Its been quite some time since I wrote the price projections of crude oil. Following the count I note that the structure looks weak and bearish. In the very short term $109 may act as a very strong support and may result in a short term counter trend rally.
In the very near term i.e. the current week we may have already seen the lows in gold and crude. Unless we take out the lows there is high probability of a counter trend rally which will be sold into. We wait for prices to resolve and give fresh trading setups.
Sahil Kapoor
Comments are welcome.
Labels:
Gold,
Metals Market Perspective
Tuesday, August 05, 2008
Metals Market Perspective
Base metals have broken key support levels. Copper prices again failed to hold the important pivot point of Rs. 330 on MCX and $3.50 on Comex. Copper prices are expected to face huge selling pressure on any rise towards Rs. 335. Copper prices look bearish and next expected support might come at Rs. 300 on MCX.
Last time I had mentioned an Elliott wave in copper which is now clearly violated. This means we have entered a downward move in copper. On the physical demand front, the sentiment has suffered due to falling US demand and emerging weakness in the Euro Area housing markets. The demand from Asia is still strong and has supplemented any weakness in the western markets. We should be net sellers of copper on any rebound to Rs. 326 to Rs. 330 with a risk potential at Rs. 337. Prices may touch Rs. 310 and Rs. 300 level in next few weeks.
Aluminium prices have broken down. But the overall trend still remains upward. Aluminium has been hit hard by the falling crude oil. In true sense it is just the sentiment that has gone against the bulls in aluminium. The long term trend is still pointing towards out performance in the current year. Rs. 120 is an important support for aluminium in INR terms, with $2800 being the pivot support on LME.
Important to note that Gold prices are down nearly $90 from the selling levels I mentioned in my previous updates. Next support now stands at $875. FOMC would be crucial to warrant any rebound.
Labels:
Metals Market Perspective
Wednesday, July 30, 2008
Elliott Wave Count on Gold - V
Gold prices have declined nearly $70 from the high of $977 which was expected to be a high. Since markets have come down below $910, it shows inherent weakness in the market. The Elliott wave structure called in for a significant decline in spite of bullish sentiment among all gold traders. Strength in USD supported the bearish sentiment in Gold prices.
In the last update I mentioned -
. . . . . . The 'C' wave has 5 wave downward impulse in the direction of the trend. We might have entered the 3rd wave of this downward 5 wave sequence within the 'C' wave. First support level from current price stands at $940 and then a pivot at $935. A daily close below $935 will take us to $910 which is the pivot point of this corrective wave . . . . . .
The Elliott wave count on Gold on a weekly graph suggests the current fall to be the strong 5 wave downward 'C' wave of the larger degree ABC correction.
$880 is the next expected level where prices would take a breather. Presently the prices are expected to face resistance at $918 to $922.
On a longer term basis Gold looks weak and a fall below $873 will make $850 highly probable. Looking at longer term graphs, Gold prices are expected to remain weak for an extended period now. Worst case scenario can take gold prices down to $716 on a break below $845.
If gold does decline below $850, will it signify that markets are expecting a softening of inflation?
In the longer term it does look like, markets have started factoring in a probability of lower inflation which means US Fed is going to clamp down on money supply with Euro zone economy staring a major slowdown. All this doesn't augur well for commodity prices. Still agricultural products continue to trade on multi year highs and may continue to do so in the near term due to basic demand and supply mismatch. Most of the emerging market central banks are now tightening and western central banks surely doesn't look far from having a hawkish bias.
Price patterns in Gold are again getting bearish. Last time there were atleast three Head and Shoulders pattern formed in gold at around $860 levels which it negated after breakdowns. Gold has formed one again with a $70 measured move at $917 on spot gold. We have a breakdown again and if this holds we might be in for a very strong down move. Risk level in Gold is now at $926 with a sell on rise to $910 to $920 approach. The graphs looks like this -
In the very short term, gold and crude oil look way too oversold and might give a rebound of sorts to sell into. So we should be adjusting our strategy to avoid sudden price shocks as volatility still remains the key in precious metals.
Market participant might also be interested in looking at the cup and handle pattern being formed in gold. This pattern if formed will take gold above a new all time high. The necessary condition for this to happen is that spot gold should not trade below $870. If it does, the odds of this pattern being relevant will be reduced to naught. Risk on this pattern is at levels of $873. So at $880 we should lighten up the positions and wait for prices to resolve.
Labels:
Gold,
Metals Market Perspective
Wednesday, July 23, 2008
Elliott Wave Count on Gold - Update
Gold prices declined from the expected levels yesterday and this could well mark an important top in the gold market for this year. If prices go below the $910 mark in the next two weeks or so, we would be looking at levels of $850 and lower. As I wrote in my earlier posts -
A price channel has been in progress from $880 to $990. A daily close below $950 will break this channel and lead to a minimum price fall of $15 to $935 . . . . . . . . . .
. . . . . . . . . . .Now we have entered the 'C' wave of a larger degree according to this count. If gold prices rebound to $970 to $980 we should be sellers with a risk potential of $989. If prices do breach this point, there would be a threat to the count and a re-examination of the prices . . . . . . .
Yesterday's price move does signify the inherent weakness of the gold prices. In the last one month most of the official world newsletters and precious metals traders have given a host of bullish arguments. Though these arguments stand well in the current economic landscape, but markets do not move of what is happening. Markets move on expectation of the future. Gold prices have failed to move to new highs inspite of all the factors which support it being at the extremes. The fresh price moves have also not been very supportive which means markets are expecting the current turbulence to abate and give way to economic recovery.
Gold prices are still in a short term uptrend. Yesterday's closing below $950 has shown the first sign of weakness and a close below $935 will further add to the weakness. Now the $910 is the most crucial support level. Have a look at the graph -
From an Elliott wave structure point of view the markets are now in the larger degree 'C' wave of the ABC correction which is represented by WXY in the graph above. The 'C' wave has 5 wave downward impulse in the direction of the trend. We might have entered the 3rd wave of this downward 5 wave sequence within the 'C' wave. First support level from current price stands at $940 and then a pivot at $935. A daily close below $935 will take us to $910 which is the pivot point of this corrective wave.
The MACD would also give a sell signal if we close below $935 this week.
Crude oil has nearly touched the expected target of $126 as it made a low of $126.37 in the August contract. Look for a counter trend rally to sell. The weekly DOE report might give some better selling levels.
This is just an update I will put up a detailed count on gold and crude as the new price data comes in.
Sahil Kapoor
Labels:
Gold,
Metals Market Perspective
Sunday, July 20, 2008
Elliott Wave Count on Gold - IV
Gold prices declined from expected levels as there was a lot of overhead supply in the market. In my last update I had mentioned -
"The prices may touch level of $980 in the near term with crucial support now building at top of wave 1 i.e. $935.5. A smaller degree impulse is also in progression which has a target of $985. With two important fibo projections at $980-$985 markets may take a breather there"
and
"The weekly graph looks as if the gold prices are in a corrective wave 'B' of a higher degree flat or expanded flat correction"
By Friday gold gave up a large part of its weekly gains and ended much lower form the weekly highs. Now the market is poised to take an important turn in the next two weeks. If gold declines below $910 there would be a serious dent in the medium to long term bull market as the severe corrective phase make take time. Since we are just into the fourth wave, the time that market would take to turn up again would be significant. In the current week starting this Monday, if gold prices close below $950 it would mark the first sign of weakness and on a further daily close below $935 prices may enter a strong downward push.
A price channel has been in progress from $880 to $990. A daily close below $950 will break this channel and lead to a minimum price fall of $15 to $935. Take a look
Gold price Elliott wave structure is generally supported by a number of Japanese candlestick patterns. We have formed one at the recent high of $990. On Friday the market closed at the price where it opened, forming a doji. If gold turns higher from this level and forms a morning star, it could seriously test the recent high.
Since the current upmove looks like corrective and not impulsive as I wrote in my previous post along with a graph (http://sahilkaps.blogspot.com/2008/07/elliott-wave-count-on-gold-iii.html), the structure has to be adjusted to new data rigorously.
With crude oil cooling off there has been a lot of money flowing into the long gold and short crude pair trade. The gold oil ratio now stands at 7.4 and actually made a multi decade low of 6.4. On an average this ratio should be around 10 taking into account that in the long term this ratio reduces over time. I went in too early into this trade and it didn't serve well. But I think the time is right to buy any weakness into this trade.
Next important target for gold should be $880 if the current count of completion of wave 'B' in a larger ABC correction holds true. Now we have entered the 'C' wave of a larger degree according to this count. If gold prices rebound to $970 to $980 we should be sellers with a risk potential of $989. If prices do breach this point, there would be a threat to the count and a re-examination of the prices.
I will put up a post on Metals Market Perspective in few days. I note that metals have corrected significantly form their peaks. Still neither copper nor aluminium has invalidated its bullish wave count. Lets see what markets has in store and price will guide us to it.
Sahil Kapoor
Labels:
Gold,
Metals Market Perspective
Saturday, July 12, 2008
Elliott Wave Count on Gold - III
The Elliott wave count on Gold which I updated last time is in progression now. The prices moved up swiftly to $968 in spot markets beginning another up move in the long term structural bull market. On daily charts the count on Gold is now showing an impulsive wave developing to the upside. The 3rd wave of this impulse is in progress and has reached nearly its threshold before giving a correction.
Lets look at the graph first.
The prices may touch level of $980 in the near term with crucial support now building at top of wave 1 i.e. $935.5. A smaller degree impulse is also in progression which has a target of $985. With two important fibo projections at $980-$985 markets may take a breather there. In the best case projections scenario a short term pop to $1002 is also possible.
Though the daily charts reflect an impulsive pattern developing and momentum to last upto $1000 or so, the weekly charts are quite the opposite. The weekly graph looks as if the gold prices are in a corrective wave 'B' of a higher degree flat or expanded flat correction.
The a-b-c correction which was very evident has been followed by another patten which looks like corrective and not impulsive. This may sound contrary to what I wrote on the daily charts above. However since we are into the corrective wave 'B' the smaller degree 'c' wave would be an impulse as it is in the direction of the higher degree correction. Have a look at the graph -
If we keep this graph in mind, we should be very cautious at levels of $980 to $1002 for pull backs. Though the wave '5' of the new impulse shown in the daily charts above may stretch beyond previous highs the overall picture is still corrective and not one of a new bull market in Gold.
Though the confidence in gold bulls is at a peak and I also feel that gold is in a long term bull market, but currently its not the time to be very bullish but to be cautious. Intelligent traders are always running scared.
The USD has been hammered against the Euro yet again. Euro gave a break out of the triangle pattern formed. The prices suggest that Euro might make a new high in weeks ahead but the overall momentum picture has deteriorated significantly. There is a serious lack of momentum and this would be the last leg up in Euro after which it will enter a prolong period of weakness. Euro may top out at around 1.64 against USD.
There has been huge inflow of funds into energy and precious metals index funds. Investors and investment banks were caught napping when equity markets tumbled and very few investors and traders could gain significant returns because of being too 'late' in the commodities spike.
I feel there is not much meaningful upside potential left in these two sectors and the next big bull run is evolving in base metals market. With huge energy costs and spiralling wage inflation combined with lack of resources and shortage of investments in production facilities, industrial metals may present decent returns in next few quarters.
There is some more pain left in the US housing markets but I feel the bottom is very near. At least in terms of market expectation we may see a bottom in housing in place by the third quarter of the current CY. If US housing markets bottom out, it would mark an important bottom in zinc prices as well. So keep an eye on it.
Sahil Kapoor
Labels:
Gold,
Metals Market Perspective
Thursday, July 10, 2008
Metals Market Perspective
Base metal prices have behaved in a very volatile fashion. Copper prices declined nearly $800 from record highs. On domestic MCX exchange copper prices have followed an important Elliott wave pattern which is in a nascent stage. If it doesn't break Rs. 346.20 on MCX and moves past its previous high of Rs. 387 we may well begin an upward journey towards Rs. 480/Kg copper. Have a look at the copper Elliott wave.
Copper prices from a charting point of view looks set to rise to Rs. 372 in the near term. Important resistance stands at Rs. 360 and pivot support at Rs. 346. Important medium term pivot is Rs. 330 below which the bull picture can get seriously damaged. Copper may test $10000 by the end of the year if it holds $7900 for a month or so.
Copper prices looks set to conquer new highs as supply disruptions gain strength. The only hindering factor in copper prices is the inventory picture. There is little outward movement from the LME warehouses and copper prices are highly correlated to the LME inventory data.
There is an expectation of a strike in Peru in next few days. Though the wave pattern is looking strong and is signalling an uptrend, we can know whether I am right or not. At current copper price of Rs. 353 on MCX and $8200 on LME we know if copper breaks Rs. 346.2 the count would come in low probability zone and below Rs. 330.80 it would be invalidated. So we would know the precise points for exit if this trade doesn't work out. However I feel copper prices are headed to new highs in the next few weeks.
Aluminium prices have behaved in perfect Elliott wave patterns. Prices made new highs twice this week and are looking set to rise further. My previous levels of $3250 has been met and prices are now approaching the $3450 mark. The Elliott wave count on aluminium looks like this. Below is the MCX aluminium near month continues chart.
The prices are expected to target Rs. 145 and Rs. 153 in the near term. Medium to long term targets are placed to Rs. 159 and Rs. 175 for aluminium traded on local exchanges.
There was an important development where Chinese smelters have agreed to cut nearly 10% of their output. China produced 1.16mn tonnes of aluminium in May which leads to a loss of 83,000 tonnes of aluminium a month. This would create a shortfall of 1 million tonnes per annum. Though this is not a huge figure for aluminium's mammoth market size, there is another important announcement. These Chinese smelters have indicated further cuts as loss making smelters are closing down altogether. There is large amount of rationing in Chinese energy sector which would lead to further cuts in the future.
This is just the beginning of the aluminium bull story and would eventually lead to $4000 aluminium by the end of this fiscal year.
Whatever be the reason for prices to move up, wave pattern indicate the expectation early.
Labels:
Metals Market Perspective
Thursday, July 03, 2008
Metals Market Perspective
The Elliott wave count on Gold that was giving a signal of downward push to the prices has been invalidated rather convincingly. The alternate count that I mentioned in my first post has picked up strength.
As of now we have exited the corrective trend channel for gold and moved out of the bearish price pattern formation. So the markets didn't spend enough time in the fourth corrective wave to mark it as an important correction. The 2nd wave of the current impulse was of nearly 19 months and the expected 4th wave zig-zag didn't last that long. Still it is premature to say that the overall structure has changed and we have entered the first upmove of the 5th impulse. It does seem that Gold became a good risk reward weighted buy after crossing $910. But the kind of exposure one can take on this volatile market needs to be debated. Gold prices would now target $960 and $980 in the next few weeks. Important price reversal point is $910.
On the Elliott wave count we have entered an impulsive lower degree 3rd wave which is projecting targets of $960 in the near term. i would update the graph on Elliott wave count on gold.
Crude oil has been rising ever since it pierced the $139 mark. Now it has already achieved the $145. Crude oil seems targeting $149 in the short term and $155 may be a medium term top. Although calling a top in the markets is fruitless exercise, still I would suggest a top of around $155 to hold in the medium term.
Copper has made a new life time high. I wrote in my previous Metals Market Perspective and the Market update posts that copper is ready to blast off the blocks. Now it seems Copper will aim for $10000 by the end of this year if it is able to clear the overhead supply till $9080. Copper has been better to trade in India as the INR depreciation has favoured the price upmove. Copper traded on the Indian commodity Exchanges has made new high in every session in the last one week. The strength seems to have furious momentum. Copper can be the next big bull in the making.
Aluminium has broken out of its $3170 resistance. The market has buying momentum. Yesterday the prices recovered $100 from days low on LME. I feel aluminium has the strength to make a new all time high in the next few weeks. The immediate target for aluminium now stands at $3250.
I would put up on article Dynamics of 'The Oil Price' in few days.
Labels:
Metals Market Perspective
Tuesday, June 24, 2008
Elliott Wave Count on Gold - II
Gold broke down just from the level which could have triggered alert signal in the structure of the wave count. The most important take from this market movement was to see the wave personality during the formation of this wave. Nearly everybody I talked to or read were bullish about gold. Which confirms that 2nd wave was in progress of the 'C' wave of the corrective zig-zag pattern.
The market has given up most of its last week gains in the first trading day of the week. This week the US Federal Reserve will come up with its rate decision. I feel there would be little to take away from this event unless Fed really comes out hawkish and say or even hint that they would raise rates sooner than September. EUR/USD which has a strong directional correlation with Gold also looks set to decline in the coming few sessions. Daily chart set up of EUR/USD looks weak but the weekly pattern has still not broken down. Euro will get into a medium term bearish zone as and when it trades below 1.5280.
Looking at the elliott wave structure of Gold I see a strong down move to $827 on a daily close below $870. The risk level still remains at $910 on the spot markets. It was hugely profitable to short the market in the latter part of last week as gold neared $908 in the spot market. NYMEX GC near month didn't break its previous immediate high of $912.5, so as an avid elliott wave practitioner it was important to go short. The current structure looks like this.
The zig zag pattern that is taking shape in gold can extend to $750. Still early days to take a call on that. If gold trades below $850, then $750 would make me very interested. Another important pattern that can be seen on the charts is a running triangle pattern which came up in discussion with one of my friends. Here it is.
If we go by the triangle and wait for the breakdown below $860, Gold targets $807 and then $750 over a 3 months period.
On the Zig-Zag pattern Gold targets a minimum of $827 on a close below $870 which would become highly probable as and when gold trades below $860 even for an hour or so. Again its important to keep an eye on the risk level which stands at $910. i will come up with other risk level as and when market breaks down.
Labels:
Gold,
Metals Market Perspective
Thursday, June 19, 2008
Elliott Wave Count on Gold
Gold market turned above the expected risk zone in the initial three days of this week. As promised I would like to share my elliot wave count on spot gold.
Currently we have completed a third wave high pointed as a major 5. The market is now in the 4th corrective wave forming a zig zag corrective pattern. The formation is a double zig zag with currently the last leg 'C' of the corrective wave in progress.
The corrective waves have followed typical 5-3-5 patterns. In the current wave we are forming the (ii) wave of the 3 of the corrective 'C' wave which would be a 5 wave sequence.
An alternate count is the possibility that market has formed an impulsive 1 and completed corrective wave 2 when it made a high of $935 and a low of $856. If we move above $910 this would bring caution bells to my mind and above $935 it would be wise to accept this alternate count and trade with it.
However the possibility of an 'c' wave being in progress looks strong as long as we hold $935. If we close below $870 on a daily basis, a move to lows of $827 would be a given. I remain cautiously bearish of gold as I was when we moved to $935. Gold market correction doesn't get over until the 'Old bulls' get burned.
As I believe, it is wise to trade the pattern then the wave.
Interestingly my focus is now turned to some profitable trades that emerged on an intraday basis in base metals. We had a very strong short covering session today. Copper, Zinc, Lead traded much higher than last week levels.
Copper has formed the classic near perfect upward impulses in the last 24hrs on local commexs. Comex copper is looking set for a sharp upmove and may have formed an important base. LME copper looks set to rise to $8450 and may be to a new high in next few weeks if volumes keep on supporting the price.
I think good trades are emerging in DJIA and local Nifty 50. We may see a very strong down move in Nifty tomorrow.
Aluminium is emerging as the trade of the year. With bullish trajectory remaining very strong since it hammered a bottom in January this year. Currently we have entered the 5 wave in aluminium and might have completed the 1st impulse today. LME aluminium looks set to target $3400 in next few weeks. Possible it is going much higher to $4000 in next few quarters. The prices have resolved into a triangle and broken out of it with record volumes and rise in open interest. I remain bullish on 'Ali' with important support at $3000 now.
Copper has formed the classic near perfect upward impulses in the last 24hrs on local commexs. Comex copper is looking set for a sharp upmove and may have formed an important base. LME copper looks set to rise to $8450 and may be to a new high in next few weeks if volumes keep on supporting the price.
The inventory on LME warehouses have been rather sticky for all the base metals and may reverse its building trend by next week.
Cancellation rates have just started to edge up and might signal some support. However, still one should be cautious where the short covering might end in Lead and Zinc.
I think good trades are emerging in DJIA and local Nifty 50. We may see a very strong down move in Nifty tomorrow.
I will come up with the counts of crude oil shortly.
Labels:
Gold,
Metals Market Perspective
Tuesday, June 03, 2008
Metals Market Perspective
Gold markets have given up large amount of gains in the recent weeks and still look weak. The USD index looks set to form a significant bottom, may be an important annual bottom in weeks to come. The US Federal Reserve and the ECB are trying all tricks up their sleeves to strengthen their respective currencies. It looks both the countries want a stronger currency to tame inflationary expectations. The Federal Reserve has already sown the seeds of economic recovery by reducing the Fed Funds rate but it might take more time for the 'Main Street' to catch up the pace it usually does after Fed reduces the cost of money.
The huge liquidity that has been created to save the 'intelligent' investment banks would have catastrophic effect on financial markets in years to come. One thing is for sure, the abnormal returns on equity portfolio would dry up for years. This is true for the emerging markets and the developed countries alike. However as and when the credit crunch abates there would be a flood of liquidity which would create bubbles across the asset classes. One such bubble would be in the emerging market equities.
Coming back to present, the current situation in the commodities markets is quite unprecedented. Crude oil and Gold are trading at extreme value to each other, copper has nearly separated itself from other industrial metals and grains are consolidating.
Currently there seems little evidence of another super rise is precious metals in the next 3 months or so. The wave structure looks weak in case of gold as we enter the most brutal 'C' wave of the double zig-zag correction. Looks like gold is going down to $806 or lower before the next quarter ends. The important point to note is the correcting fractals of the corrective wave in gold. The upmove to $1034 from $860 took lesser time than the current corrective pattern. This means the major uptrend is still very much intact. Gold generally consolidates for lengthy time periods before moving higher and that too in between the 200DMA and 50 DMA. So we are going down in Gold in next few weeks if we break $864 in the spot markets even on a 240 minutes closing basis. A head and shoulders pattern will cap upside in Gold as levels of $880 will be crucial resistance for markets to overcome. This is the potential risk zone with targets at $823 and $806 making it a good risk reward trade on yesterdays market closing.
Its time to watch out for Crude oil in the next week as it moves in a range of $131 to $138. Break above or below would decide the short term momentum. We look forward to crude oil touching $144 next week on a close above $138 on 240 minutes bars and $149 looks probable but it has too many people betting money on it. It has been seen so many times that when markets start deciding the amount of time and price move in 'When and by how much' rather then in which direction, its the time to cut your positions and wait for the reversal. I feel anything above $120 is an extension on our count and will probably end in tears. Still we are in just the third wave, fourth wave will be punishing and would probably be a zig-zag from $144 or $150. Its always better to trade the pattern then the wave.
I will post the graphs of my elliot wave count in the next few days.
Labels:
Metals Market Perspective
Subscribe to:
Posts (Atom)